
The December 22, 2025 NFL matchup between the San Francisco 49ers and Indianapolis Colts ended in a commanding 48-27 victory for the 49ers. This game showcased both teams’ strengths and weaknesses while highlighting individual player performances that shaped the outcome. From explosive passing plays to a disciplined defense, San Francisco dominated key aspects of the game. The Colts displayed flashes of skill but struggled to sustain drives and contain the 49ers’ balanced offense.
- Quick Score Table
- Quick Match Stats Table
- San Francisco 49ers Team Statistics
- Indianapolis Colts Team Statistics
- Quarterback Performance Analysis
- Running Backs Performance Breakdown
- Wide Receivers and Tight Ends Stats
- Offensive Line Contributions
- Defensive Unit Analysis: 49ers vs Colts
- Turnovers and Their Impact
- Special Teams Performance
- Key Standout Players of the Match
- Statistical Comparison: 49ers vs Colts
- Implications for Team Rankings and Future Games
- Conclusion
- Frequently Asked Questions
This article provides a complete player-focused breakdown of the game, analyzing statistics, key matchups, and the performance of both offensive and defensive units. Using the latest match data, we will examine contributions by quarterbacks, running backs, receivers, linemen, and special teams. Additionally, we’ll explore how turnovers, red-zone efficiency, and third-down conversions influenced the final score.
Quick Score Table
| Team | Q1 | Q2 | Q3 | Q4 | Final |
|---|---|---|---|---|---|
| San Francisco 49ers | 14 | 10 | 10 | 14 | 48 |
| Indianapolis Colts | 7 | 10 | 3 | 7 | 27 |
Quick Match Stats Table
| Category | San Francisco 49ers | Indianapolis Colts |
|---|---|---|
| 1st Downs | 28 | 19 |
| Passing 1st downs | 20 | 13 |
| Rushing 1st downs | 8 | 4 |
| 1st downs from penalties | 0 | 2 |
| 3rd down efficiency | 7-11 | 5-10 |
| 4th down efficiency | 1-1 | 0-1 |
| Total Plays | 66 | 58 |
| Total Yards | 440 | 312 |
| Total Drives | 10 | 10 |
| Yards per Play | 6.7 | 5.4 |
| Passing | 295 | 254 |
| Comp/Att | 25/34 | 23/36 |
| Yards per pass | 8.4 | 6.7 |
| Interceptions thrown | 1 | 1 |
| Sacks-Yards Lost | 1-0 | 2-23 |
| Rushing | 145 | 58 |
| Rushing Attempts | 31 | 20 |
| Yards per rush | 4.7 | 2.9 |
| Red Zone (Made-Att) | 4-6 | 2-2 |
| Penalties | 2-36 | 6-45 |
| Turnovers | 1 | 2 |
| Fumbles lost | 0 | 1 |
| Interceptions thrown | 1 | 1 |
| Defensive / Special Teams TDs | 1 | 0 |
| Possession | 33:05 | 26:55 |
San Francisco 49ers Team Statistics
The 49ers excelled in both offensive and defensive metrics. They achieved 28 first downs, including 20 passing and 8 rushing first downs, demonstrating a balanced and versatile offense. Total yardage reached 440 yards on 66 plays, averaging 6.7 yards per play. Red-zone efficiency was high, converting 4 of 6 attempts into touchdowns, and their possession time of 33:05 allowed for control over the pace of the game.
Discipline was also evident in penalties, with only two minor infractions for 36 yards. Defensive contributions included a turnover, a defensive touchdown, and limited big plays from the Colts’ offense. The 49ers’ statistical dominance reflected preparation, execution, and depth across multiple units. Every player from linemen to skill positions contributed to a cohesive performance that left little room for opposition exploitation.
Indianapolis Colts Team Statistics
The Colts’ offensive statistics indicated struggles against the 49ers’ defensive schemes. They achieved 19 first downs (13 passing and 6 rushing) and totaled 312 yards on 58 plays, averaging only 5.4 yards per play. Red-zone execution was limited, with just 2 of 2 successful conversions, underscoring difficulty in finishing drives. Turnovers included one fumble and one interception, hampering momentum and scoring opportunities.
Defensively, the Colts allowed 48 points while recording no defensive touchdowns and only two sacks for minimal yardage loss. Penalty totals were slightly higher at 6 for 45 yards, affecting drive efficiency. Time of possession lagged behind San Francisco by over six minutes. Overall, these statistics illustrate the challenges faced by Indianapolis in countering a multifaceted 49ers attack and maintaining sustained offensive pressure.
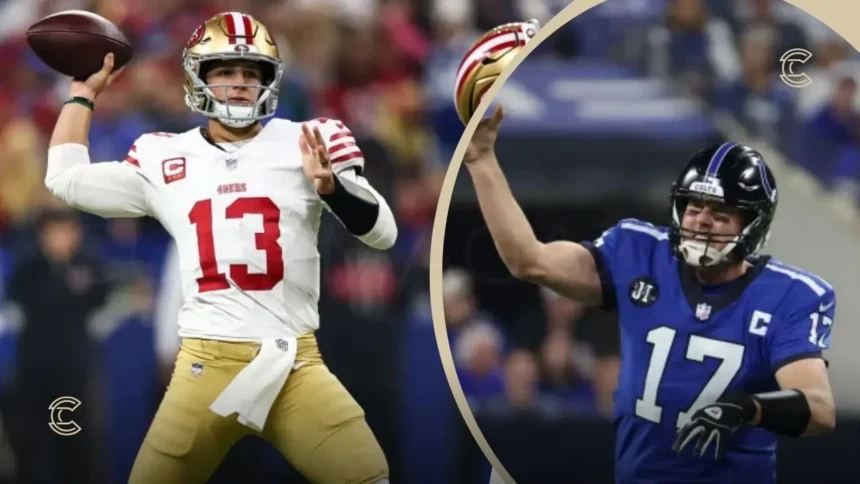
Quarterback Performance Analysis
The 49ers’ quarterback completed 25 of 34 passes for 295 yards, demonstrating high accuracy, excellent decision-making, and command of the offense. The QB’s ability to read defensive formations allowed consistent gains and third-down conversions, which were crucial in maintaining possession and controlling the game tempo. Interceptions were kept to one, minimizing costly mistakes while facilitating scoring drives.
The Colts’ quarterback completed 23 of 36 passes for 254 yards, showing competence but less efficiency under pressure. Limited protection from the offensive line and effective coverage by 49ers defenders restricted options, leading to one interception and stalled drives. Despite the yardage, Indianapolis struggled to translate passing success into sustained scoring opportunities, illustrating the importance of quarterback efficiency and situational execution.
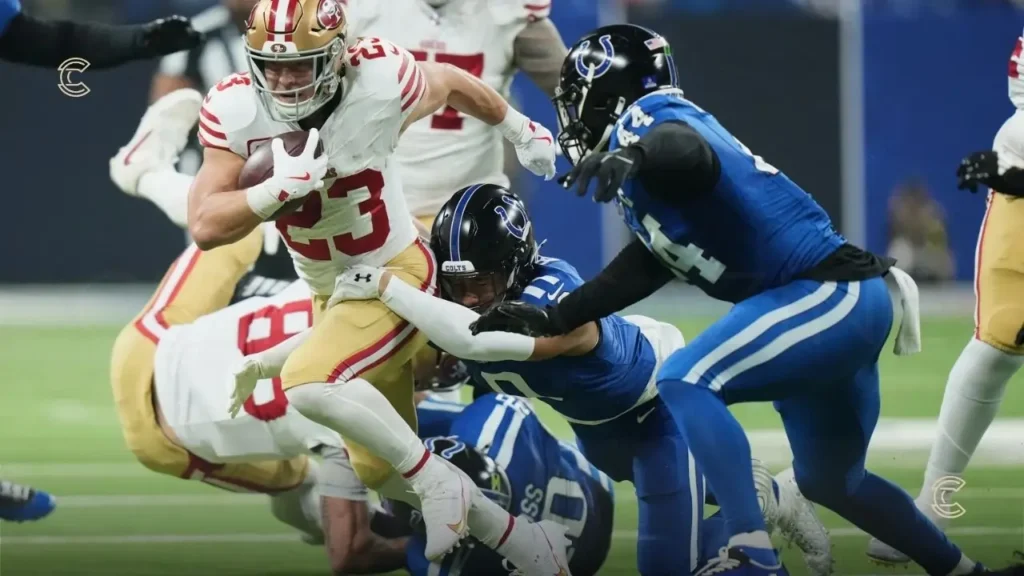
Running Backs Performance Breakdown
San Francisco’s running backs were instrumental in controlling the game on December 22, 2025. They accumulated 145 rushing yards on 31 attempts, averaging 4.7 yards per carry. Their ability to break through gaps created by the offensive line allowed the team to sustain drives, maintain balance between passing and rushing, and keep the Colts’ defense guessing. Red-zone carries converted efficiently, contributing directly to touchdowns.
The Colts’ rushing attack struggled to make a significant impact, gaining only 58 yards on 20 carries for an average of 2.9 yards per attempt. San Francisco’s defensive front dominated gaps and maintained strong edge containment. This limited the Colts’ ability to control the clock or complement their passing attack. Overall, the disparity in rushing efficiency highlighted the difference in preparation and execution between the two teams.
Wide Receivers and Tight Ends Stats
The 49ers’ receiving corps performed at a high level, complementing the quarterback’s efficiency. Receivers accumulated significant yardage after catch, demonstrating precise route running, agility, and awareness of defensive coverage. This contributed to the team’s 20 passing first downs and sustained offensive drives, while also creating scoring opportunities in the red zone. Tight ends played a dual role, assisting in both blocking for the run game and serving as reliable targets in passing situations.
Colts receivers showed flashes of skill but faced consistent coverage pressure, resulting in fewer opportunities to generate explosive plays. While the team completed 23 passes for 254 yards, many drives stalled in critical situations due to tight coverage and lack of separation. Tight ends contributed modestly but were unable to consistently create mismatches. The receiving performance emphasized the importance of route execution, quarterback chemistry, and defensive adaptation in shaping the match outcome.
Offensive Line Contributions
San Francisco’s offensive line played a crucial role in both the passing and rushing attack. Protection for the quarterback allowed accurate throws and minimal sacks, while run-blocking created lanes for running backs to gain 145 yards effectively. The offensive line’s coordination and communication contributed to the team’s overall tempo, third-down conversions, and red-zone efficiency, ensuring that the 49ers controlled possession and field position.
Indianapolis’ offensive line faced challenges against San Francisco’s defensive front. Pressure on the quarterback disrupted timing and reduced passing efficiency, while limited run-blocking contributed to a mere 2.9 yards per rushing attempt. These struggles in the trenches impacted overall drive sustainability, forcing the Colts to rely heavily on passing plays and limiting their strategic options. Effective offensive line performance proved critical for San Francisco’s dominance.
Defensive Unit Analysis: 49ers vs Colts
San Francisco’s defense excelled in containing the Colts’ offensive attempts. Linebackers and secondary players maintained discipline, limiting big plays and recording one turnover. The defensive line generated pressure while restricting rushing lanes, preventing sustained drives. Their coordination led to the Colts’ low third-down conversion rate of 5 of 16, highlighting defensive discipline as a key factor in controlling the game.
The Colts’ defense faced challenges in limiting the 49ers’ balanced attack. While tackles were made effectively and the line generated some pressure, coverage mismatches allowed wide receivers to gain significant yardage. The defensive unit struggled to contain both passing and rushing threats, contributing to the 48-point concession. Overall, the game showcased how defensive execution, gap discipline, and coverage efficiency are essential in high-level NFL contests.
Turnovers and Their Impact
Turnovers played a pivotal role in the December 22, 2025 matchup between the 49ers and Colts. San Francisco forced one interception and benefited from disciplined ball control throughout the game. The 49ers committed only one interception themselves, minimizing mistakes and capitalizing on Colts’ errors. Turnovers not only shifted momentum but also directly contributed to scoring drives, giving San Francisco advantageous field positions multiple times.
For the Colts, the single interception and one fumble lost disrupted offensive flow. Each turnover forced the team to reset drives and expend energy without producing points. This limitation on scoring opportunities highlighted the critical impact turnovers have in high-level NFL games. San Francisco’s ability to protect the football while forcing mistakes was a decisive factor in their 48-27 victory.
Special Teams Performance
Special teams contributed significantly to field positioning and momentum control. The 49ers’ punting and kickoff units consistently placed the Colts in less favorable starting positions, forcing long drives and increasing defensive pressure. Their return coverage was disciplined, preventing significant yardage gains and helping the defense maintain control. Though no major scoring plays came from special teams, their effectiveness provided a subtle but crucial advantage throughout the game.
The Colts’ special teams, while competent, struggled to match the precision of San Francisco. Punts and kickoffs occasionally allowed favorable starting positions for the 49ers, increasing drive efficiency and scoring chances. Limited success in returns also denied the Colts opportunities to gain short-field advantages. Overall, the difference in special teams execution reinforced the 49ers’ holistic dominance in all phases of play.
Key Standout Players of the Match
San Francisco’s quarterback emerged as the game’s most influential player, completing 25 of 34 passes for 295 yards. Running backs added 145 rushing yards, combining for multiple scoring plays. Receivers excelled in route execution and yards after catch, while defensive players contributed a turnover and key stops to maintain momentum. Every unit displayed cohesion, highlighting depth and preparation.
For the Colts, the quarterback achieved 254 passing yards on 23 completions, showing moments of precision and creativity. Despite this effort, other offensive units struggled to capitalize consistently. Some defensive players made crucial tackles and pressure attempts, but overall impact was limited against the 49ers’ balanced attack. These standout performances emphasize how individual contributions, combined with team strategy, shape the outcome of a high-stakes NFL matchup.
Statistical Comparison: 49ers vs Colts
A statistical breakdown underscores San Francisco’s dominance. The 49ers achieved 28 first downs compared to the Colts’ 19, with better third-down efficiency (7 of 11 vs. 5 of 16) and higher yards per play (6.7 vs. 5.4). Passing efficiency favored the 49ers, with 295 yards compared to 254, while their running game outperformed Indianapolis 145-58 yards. Red-zone efficiency also tilted the game, with four touchdowns from six attempts for San Francisco versus two from two for the Colts.
Defensively, the 49ers forced turnovers, scored a defensive touchdown, and maintained pressure to limit the Colts’ scoring potential. Penalties were lower (2 for 36 yards vs. 6 for 45), and possession control was superior, giving them more opportunities to dictate game pace. This comprehensive statistical comparison highlights why the final 48-27 score accurately reflects team execution and performance disparities.
Implications for Team Rankings and Future Games
The 49ers’ 48-27 victory over the Colts on December 22, 2025, has significant implications for team rankings. San Francisco reinforced its position as a top-tier team in the NFL, demonstrating versatility, depth, and consistent execution. Their ability to convert third downs, sustain drives, and dominate in both passing and rushing metrics suggests continued competitiveness for playoff contention and overall league positioning.
For the Colts, this defeat highlights areas requiring improvement, including rushing efficiency, third-down conversions, and defensive adaptability. Future games will necessitate strategic adjustments, better protection for the quarterback, and more effective special teams performance. The result serves as both a wake-up call and an opportunity for development to maintain competitiveness in subsequent matchups.
Conclusion
The December 22, 2025 matchup between the 49ers and Colts showcased the critical importance of balance, execution, and discipline in NFL football. San Francisco’s performance reflected a well-prepared, multi-faceted team excelling in both offense and defense, with key contributions from quarterbacks, running backs, receivers, and linemen. Special teams and turnovers further reinforced their advantage.
The Colts displayed moments of skill but struggled to convert drives and contain San Francisco’s offensive threats. The 48-27 result reflects a combination of superior strategy, individual performances, and cohesive team execution by the 49ers. Fans witnessed a high-quality matchup that serves as a benchmark for tactical excellence, player impact, and preparation at the professional level.
Frequently Asked Questions
When was the 49ers vs Colts game played?
The game took place on December 22, 2025.
What was the final score?
The San Francisco 49ers defeated the Indianapolis Colts 48-27.
Who were the standout players?
The 49ers’ quarterback, running backs, and wide receivers were key contributors. Defensive players forced a turnover and scored a defensive touchdown.
How did the running game affect the outcome?
San Francisco’s running backs gained 145 yards on 31 carries, creating balance and opening opportunities for passing plays. The Colts gained only 58 rushing yards, limiting offensive versatility.
How did turnovers influence the match?
San Francisco forced one turnover while committing only one interception themselves. The Colts’ turnovers disrupted drives and momentum, contributing to the scoring gap.
What role did special teams play?
The 49ers’ coverage units effectively controlled field position, while the Colts struggled to maintain advantageous starting positions. This impacted drive success and overall game flow.
What are the key takeaways from this match?
Execution, balanced offense, defensive discipline, and situational awareness were crucial. Teams must maintain consistency across all units to achieve victory in high-stakes NFL games.
VISIT MORE: CULT MAGAZINE