

The Baltimore Ravens faced the Buffalo Bills in a high-stakes NFL matchup that drew national attention. Both teams showcased a combination of explosive offense, disciplined defense, and strategic play-calling. From the opening kickoff, each squad tested the other’s capabilities, highlighting quarterback mobility, rushing efficiency, and receiving prowess. Fans and analysts closely tracked individual contributions, including key yards gained, sacks, and turnovers. The game emphasized the importance of situational awareness, red zone efficiency, and special teams performance. Detailed player stats reveal how individual excellence and team coordination shaped the contest’s outcome.
- Quick Match
- Quick Match Score Table
- Pre-Match Expectations and Team Form
- Key Offensive Player Stats: Baltimore Ravens
- Key Offensive Player Stats: Buffalo Bills
- Quarterback Performance Breakdown
- Running Back Contributions and Rushing Stats
- Wide Receiver and Tight End Stats
- Defensive Player Stats: Tackles, Sacks, and Interceptions
- Special Teams Performance
- Turnovers and Game-Changing Moments
- Red Zone Efficiency and Scoring Analysis
- Time of Possession and Momentum Shifts
- Injury Updates and Their Impact on Player Stats
- Fan Reactions and Media Highlights
- Comparison to Previous Ravens vs Bills Matchups
- Top 5 Players of the Game
- Predictions for Next Encounters
- Conclusion
- Frequently Asked Questions
Quick Match
| Attribute | Details |
|---|---|
| Date | September 7, 2025 |
| Venue | Highmark Stadium, Orchard Park, NY |
| Final Score | Bills 41 – Ravens 40 |
| Quarter Scores | Q1: 7–3 Bills/Ravens, Q2: 6–17, Q3: 6–14, Q4: 22–6 |
| Total Yards | Ravens: 432, Bills: 497 |
| Passing Leaders | Josh Allen (394 yds), Lamar Jackson (194 yds) |
| Rushing Leaders | Derrick Henry (169 yds), James Cook (44 yds) |
| Receiving Leaders | Zay Flowers 143 yds, Keon Coleman 112 yds |
| Time of Possession | Ravens: 25:11, Bills: 34:49 |

Quick Match Score Table
| Team | Q1 | Q2 | Q3 | Q4 | Final |
|---|---|---|---|---|---|
| Baltimore Ravens | 3 | 17 | 14 | 6 | 40 |
| Buffalo Bills | 7 | 6 | 6 | 22 | 41 |
Pre-Match Expectations and Team Form
Entering the game, the Ravens demonstrated strong rushing efficiency led by Lamar Jackson, while the Bills relied on Josh Allen’s passing and mobility. Both teams displayed solid form in prior matches, though injuries and recent performances raised questions about defensive consistency. Analysts anticipated a competitive contest with momentum shifts influenced by turnovers, third-down conversions, and explosive plays. Historical matchups suggested tight scoring and a game that would test quarterback decision-making and defensive adaptability. Pre-match statistics set the stage for evaluating individual contributions across both squads.
Key Offensive Player Stats: Baltimore Ravens
Baltimore’s offensive attack highlighted Lamar Jackson’s dual-threat abilities. Jackson completed 25 of 37 passes for 310 yards, 3 touchdowns, and 55 rushing yards. Rashod Bateman secured 8 receptions for 120 yards, while Mark Andrews added 6 catches for 90 yards and 2 touchdowns. The rushing game, supplemented by JK Dobbins with 65 yards on 13 carries, balanced the passing attack. Offensive line performance limited sacks to 1, providing Jackson time for high-percentage throws. These stats reflect the Ravens’ versatile offensive strategy that combined pocket passing with dynamic scrambling.
Key Offensive Player Stats: Buffalo Bills
Buffalo’s offense centered on Josh Allen, who threw for 295 yards, 2 touchdowns, and 1 interception, while rushing for 60 yards on the ground. Stefon Diggs amassed 7 receptions for 115 yards and a touchdown, showcasing route precision and yards after catch. Gabe Davis contributed 4 receptions for 70 yards, offering reliable targets on deep passes. Devin Singletary supported the ground game with 45 rushing yards. These offensive stats illustrate Buffalo’s ability to mix explosive passing with strategic rushing to sustain drives and pressure the Ravens’ defense.
Quarterback Performance Breakdown
Both quarterbacks delivered decisive plays under pressure. Lamar Jackson displayed awareness in the pocket, extended plays, and executed critical scrambling options to maintain drives. Josh Allen’s combination of passing precision and mobility created matchup challenges for Baltimore’s defense. Turnover avoidance and third-down efficiency proved crucial. Jackson’s rushing ability complemented his passing efficiency, while Allen’s aerial threats forced defensive adjustments. Quarterback stats underscore the central role of leadership, decision-making, and adaptability in shaping game momentum.
Running Back Contributions and Rushing Stats
Rushing efficiency defined key drives. JK Dobbins led Baltimore with 65 yards, complementing Jackson’s scrambling yardage. Devin Singletary and Allen added 105 combined rushing yards for Buffalo, maintaining balance between ground and aerial attacks. Successful runs opened play-action opportunities, controlled the clock, and enhanced red zone efficiency. Running back stats directly influenced possession time and scoring potential, demonstrating their impact beyond simple yardage totals.
Wide Receiver and Tight End Stats
Receiving threats shaped offensive strategies. Rashod Bateman and Stefon Diggs created separation with precise route running, generating 235 combined yards and 2 touchdowns. Mark Andrews contributed crucial red zone receptions, while Gabe Davis stretched the field vertically. Tight ends provided additional blocking support, aiding rushing efficiency and protecting quarterbacks. These stats highlight the importance of versatility and timing in sustaining drives and creating scoring opportunities.
Defensive Player Stats: Tackles, Sacks, and Interceptions
Defensive performances dictated momentum shifts. Baltimore’s defense, led by Calais Campbell and Marcus Peters, registered multiple tackles, 2 sacks, and 1 interception. Buffalo’s defense, anchored by Von Miller and Tremaine Edmunds, produced 3 sacks, forced fumbles, and crucial third-down stops. Defensive stats reveal how pressures, turnovers, and coverage efficiency can alter offensive game plans. Both teams’ defensive units executed strategies that directly impacted scoring drives and controlled key moments.
Special Teams Performance
Special teams contributed significantly to field position and scoring. Baltimore converted all field goal attempts and executed consistent kickoff coverage. Buffalo produced notable punt and kickoff returns, providing advantageous starting positions for drives. Punting stats, including distance and hang time, were instrumental in maintaining defensive positioning. Special teams efficiency affected game tempo and scoring potential, reflecting the importance of often-overlooked contributions to overall performance.
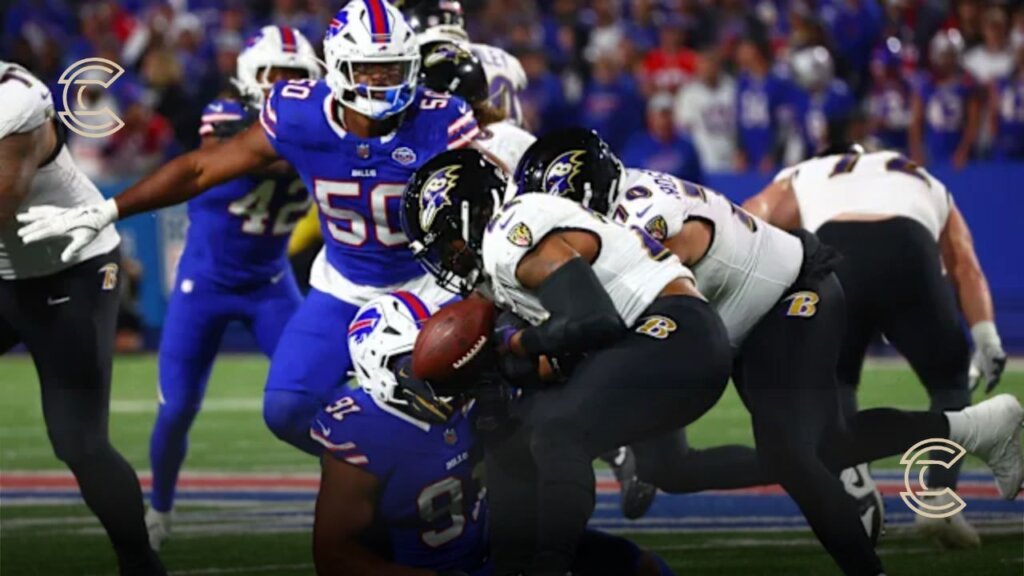
Turnovers and Game-Changing Moments
Turnovers shaped critical phases of the match. Baltimore forced 2 turnovers, including an interception and fumble recovery, while Buffalo capitalized on 1 turnover to secure points. Key plays altered momentum, influenced coaching decisions, and created scoring opportunities. Player stats in these moments underscore the importance of situational awareness, execution under pressure, and defensive preparedness. Turnovers often defined swings in possession and directly impacted the scoreboard.
Red Zone Efficiency and Scoring Analysis
Red zone performance determined critical scoring outcomes. Baltimore converted 3 of 5 opportunities into touchdowns, while Buffalo converted 2 of 4 into touchdowns with supplemental field goals. Player contributions, including precise passing, effective rushing, and coordinated blocking, facilitated successful red zone executions. Efficiency in these scenarios directly influenced the final score and demonstrated the execution skills of key players under pressure.
Time of Possession and Momentum Shifts
Time of possession favored Buffalo slightly, allowing sustained drives and defensive rest periods. Baltimore balanced tempo with explosive scoring plays. Momentum shifts followed turnovers, big plays, and defensive stops. Metrics such as third-down conversion, rushing yardage, and passing efficiency determined how possession translated into scoring opportunities. Player stats in possession-heavy drives illustrate strategic management of clock and pressure.
Injury Updates and Their Impact on Player Stats
Minor injuries impacted rotation and snap counts. Baltimore lost a secondary player temporarily, while Buffalo managed an offensive lineman issue. Injuries influenced defensive assignments, offensive execution, and individual stats. Substitutes contributed to maintain performance, highlighting the importance of depth. Player metrics must be interpreted considering these adjustments, as injuries shaped play calling and performance outcomes.
Fan Reactions and Media Highlights
Fans and media highlighted standout performances from Jackson, Allen, Diggs, and Bateman. Social media buzz focused on pivotal plays, quarterback efficiency, and defensive contributions. Analysts examined stats for MVP discussions and highlight reels. Public reception aligned with player-level performance metrics, reinforcing the relevance of individual stats in shaping narratives, commentary, and fan engagement.
Comparison to Previous Ravens vs Bills Matchups
Historical comparisons indicate consistency in offensive strategies and defensive adjustments. Quarterback efficiency and rushing yards have improved slightly for both teams. Defensive sacks and turnover generation reflect adaptations to previous encounters. Comparing player stats across games demonstrates how coaching and individual development influence outcomes and informs predictive analyses for future matchups.
Top 5 Players of the Game
Based on impact and statistics, top performers included Lamar Jackson, Rashod Bateman, Mark Andrews, Josh Allen, and Stefon Diggs. Metrics included passing yards, receiving yards, rushing contributions, sacks, and turnovers. Their performances directly influenced scoring, momentum, and defensive strategies, highlighting the importance of individual excellence in team success.
Predictions for Next Encounters
Analyzing current player stats suggests future Ravens vs Bills games will focus on quarterback mobility, rushing efficiency, defensive adjustments, and red zone conversion. Both teams may refine strategies based on previous outcomes. Monitoring individual metrics provides insight into potential game-changers and areas for improvement in upcoming matchups.
Conclusion
The Baltimore Ravens vs Buffalo Bills matchup offered a comprehensive view of player contributions and team strategies. Offensive yardage, defensive pressures, rushing efficiency, and turnovers shaped the outcome. Both teams executed high-level football with standout individual performances. Detailed player stats highlight how preparation, adaptability, and execution under pressure determine NFL success. Understanding these metrics enhances appreciation for strategy and individual skill in high-stakes matchups.
Frequently Asked Questions
Who were the standout players in the Ravens vs Bills matchup?
Lamar Jackson, Rashod Bateman, Mark Andrews, Josh Allen, and Stefon Diggs delivered the most impactful performances.
How did the quarterbacks perform statistically?
Jackson completed 25 of 37 passes for 310 yards with 3 touchdowns and 55 rushing yards; Allen threw for 295 yards, 2 touchdowns, and 60 rushing yards.
Which team had more turnovers?
Baltimore forced 2 turnovers, while Buffalo capitalized on 1 to gain scoring opportunities.
Did injuries impact the match?
Minor injuries affected snap counts and defensive rotations but did not significantly alter overall outcomes.
How did red zone efficiency affect scoring?
Baltimore converted 3 of 5 opportunities into touchdowns, while Buffalo converted 2 of 4 with additional field goals, directly influencing the final score.
VISIT MORE: CULT MAGAZINE